P0420 Code on Fleet Vehicles: Diagnosis, Costs & Impact
TL;DR 4 key takeaways Definition: The P0420 code indicates that the catalyst on bank 1 of a vehicle is operating below the efficiency threshold,...

.jpeg)
Published on April 14, 2020 in Fleet Management by Geotab Data & Analytics Team
This is a regional interpretation for Eastern Canada of Geotab’s published article The Impact of COVID-19 on commercial transportation and trade activity updated on April 14th 2020.
With the current COVID-19 pandemic, now more than ever, it is important to leverage fleet intelligence solutions. Our partners at Geotab Data & Analytics Team have identified changes to commercial transportation and trade activity since the onset of COVID-19, based on an analysis of anonymized and aggregated insights from its base of over 2 million commercial vehicles which includes:
+400,000 Heavy Duty Trucks
+256,000 Vocational Trucks
+200,000 Medium Duty Trucks.
Overview
The insights are split into two categories to better illustrate the impact on the commercial transportation sector in North America.
1. Commercial transportation activity includes regional volume of trips and fuel activity, split by various operations.
2. Trade activity includes metrics that help show how trade has been affected, from border wait times to port activity.
From Monday, March 16 to Friday, March 27, there has been a significant drop in commercial transportation activity in both the U.S. and Canada when baselined against data from February 1 to March 15. On average, Canada is operating at 79% of normal commercial transportation activity, with the Maritimes operating at 69% (the lowest percentage compared to normal.)
The chart also shows the impacts on fleet activities of new mandatory closures on Sundays in Quebec and the beginning of the Easter Holiday.
In the U.S., the impact is more significant, operating at an average of 82% of normal commercial transportation activity and the U.S. Federal Region, which includes the State of New York and New Jersey, most impacted at 63% of normal activity.
The heat map below shows a region-by-region breakdown of commercial transportation volumes based on a percentage drop from a normal weekday or weekend, baselined against metrics from February 1 to March 15, 2020.
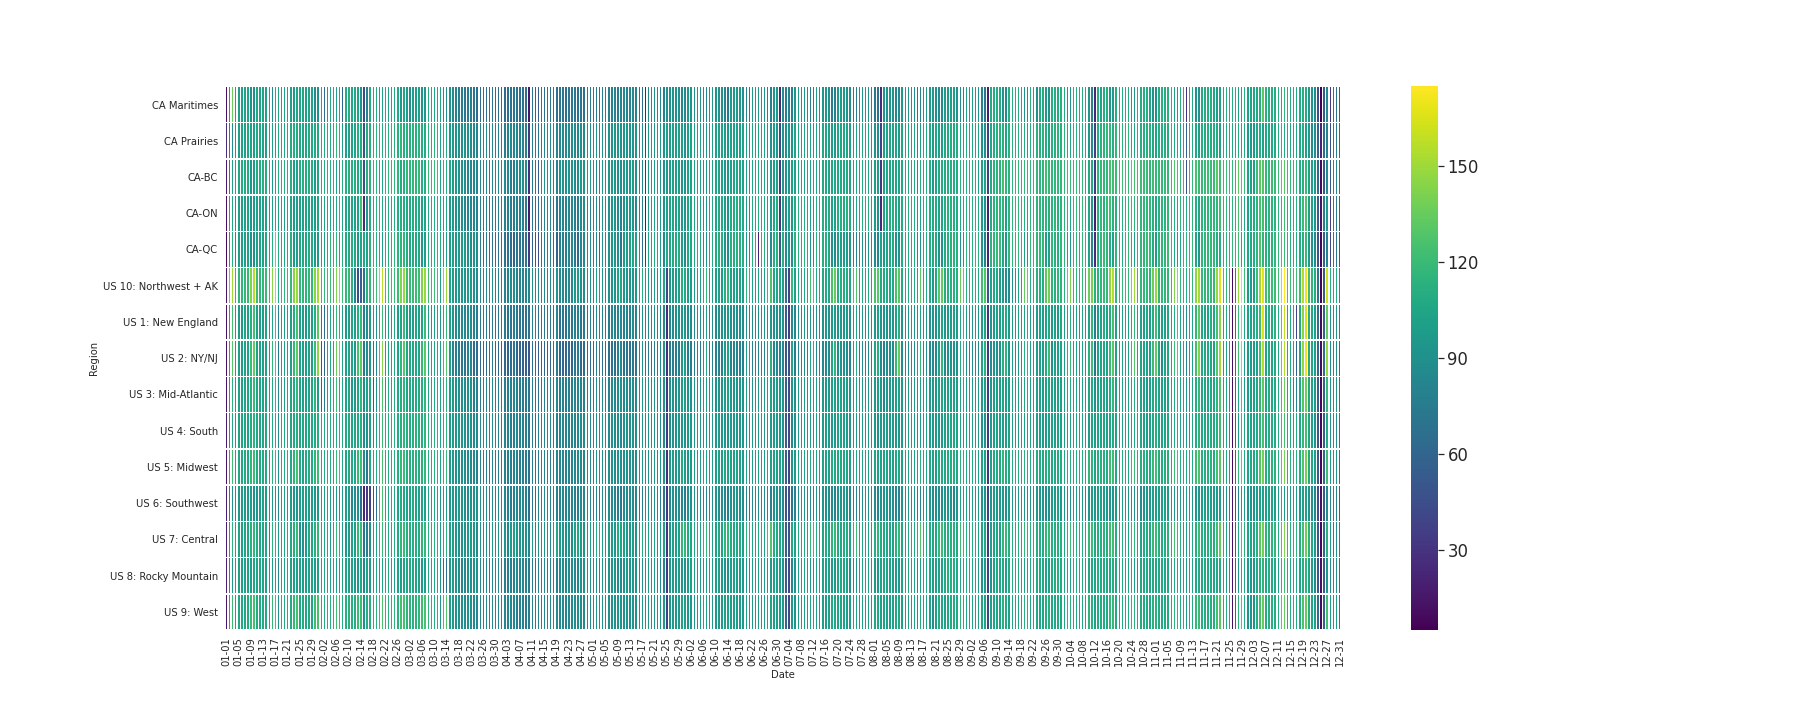
Figure 1. Commercial vehicle activity volume as a percentage of normal operations by macro region in Canada and the U.S.
Applying the same analysis to Latin America yielded similar results in aggregate, but we see vast differences in fleet activity from country to country, though it is unclear whether this can be attributed to Covid-19 as the sample size of vehicles is smaller and the demographics of Geotab-connected fleets may vary greatly between localities.

Figure 2. Commercial vehicle activity volume between Canada and the United States, as a percentage of normal operations.
From the graphic, it appears that commercial fleet activities in both countries have slowed but remain relatively stable up to Easter Holiday Weekend.
Even though commercial fleet activities remain somewhat stable, there is a noteworthy difference in the decline of commercial vehicle activity between Heavy-Duty trucks at 89% of the normal activity and cars at 69% of the normal activity, baselined against data from February 1 to March 15, 2020. The chart displays Heavy-Duty trucks (HDT), Medium-Duty trucks (MDT), Light-Duty trucks (LDT), and Multi-purpose vehicles such as vans (MPV).
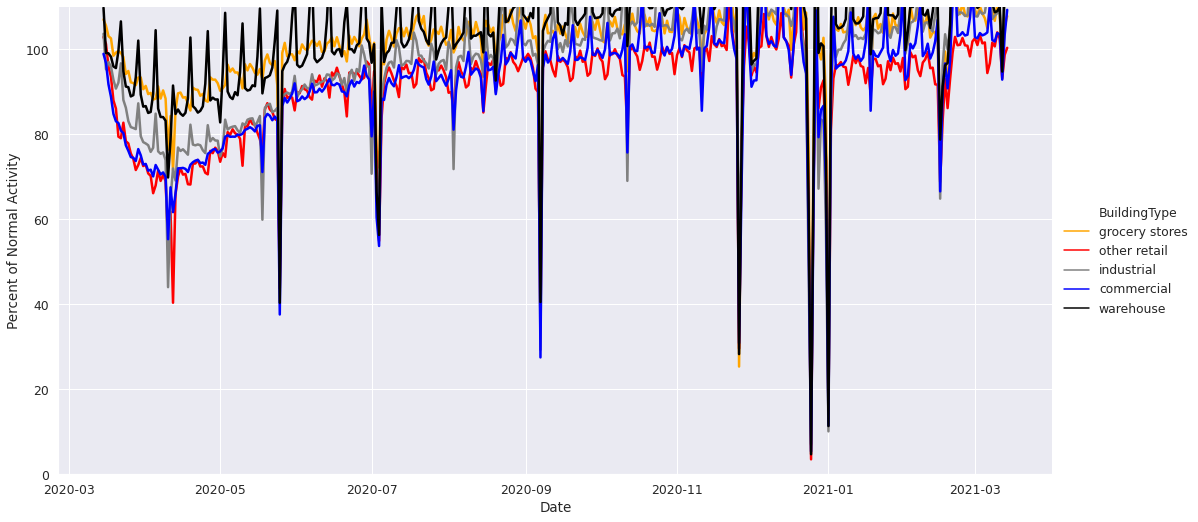
Figure 5. Longitudinal view of commercial traffic volume in North America, measured by number of trips relative to normal activity, broken down by class of vehicle.
Using building locations and tags from OpenStreetMap, Geotab analyzed how the reduction in commercial traffic impacted each industry: industrial, commercial, retail and warehouses (grocery stores and supermarkets were considered separately.)
The dataset suggests that all retail, industrial and commercial locations have been impacted by the drop in commercial transportation activity. However, it is somewhat encouraging to note that commercial transportation activity to grocery stores has dropped the least, with 90% of normal activity. It is important to note that this activity comprises both delivery of goods but other services as well.
Figure 6. Grocery stores, retail, commercial, industrial and warehouse activity in the U.S., Canada and Mexico.
Impact on fuel use in commercial transportation
With a drop in commercial transportation activity, a notable decline in fuel consumption would also be expected. However, this trend is not evident across all types of commercial vehicles. The trucking economy has been quite steady, which equates to the consistent (if not increased) demand for the transportation and logistics sector. As schools are closed and social distancing measures are being taken, a drop in bus activity is also consistent with what we’re seeing in the data below.
The chart below shows normal fuel fill-up activity in the U.S. since February 29 and illustrates by class of vehicle how that has changed during the COVID-19 pandemic.
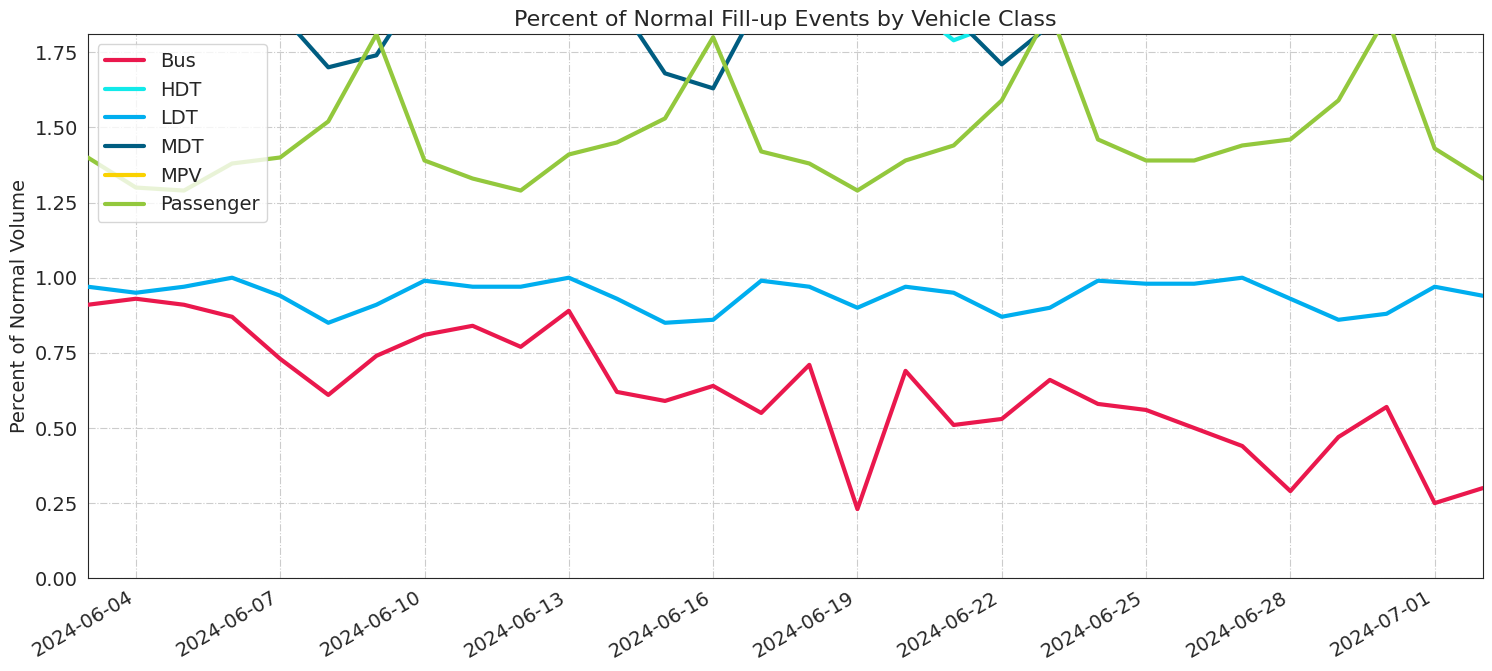
Figure 7. Weight class fueling percent of normal volume.
It is important to understand how trade is being impacted by this pandemic. Is commercial activity to and from ports and airports remaining consistent? What does border crossing activity look like? The insights presented below analyze the impact COVID-19 is having on commercial trade traffic through the examination of borders and ports in Canada and the U.S.
Border trip and wait times have dropped
At the major U.S.-Canada border crossings in Ontario: Detroit-Windsor, Fort Erie, Queenstown and Sarnia, the data suggests a drop in cross-border activity to 70% of normal commercial transportation volumes, baselined against normal operations from February 1 to March 15, 2020. For further insights on how COVID-19 is impacting cross-border activity, read more here.
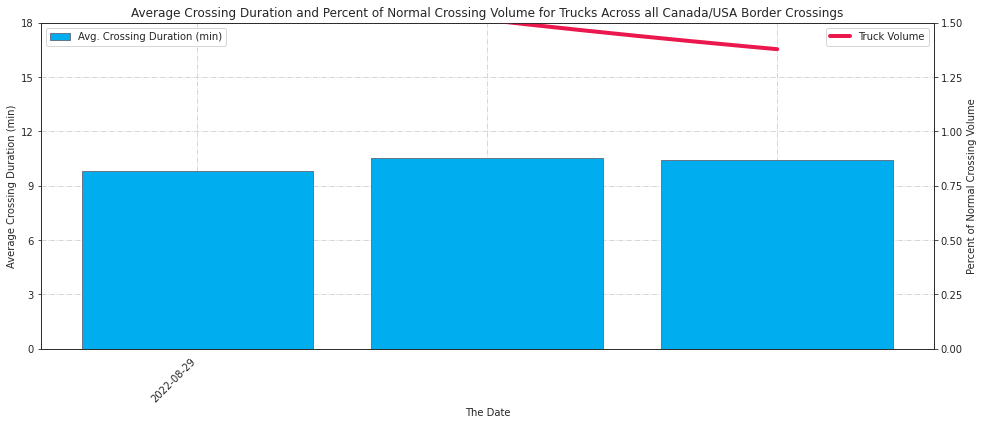
Figure 8. Average crossing duration and percent of normal crossing volume for trucks across all U.S.-Canada border crossings.
Airport activity
An analysis was performed that examined the commercial transportation activity volume to and from select Canadian and U.S. airports baselined against volumes from February 1 to March 15, 2020. In the four Canadian airports analyzed, there was an average decrease in volume of 25% from March 16 to March 31, with Toronto’s Pearson International Airport experiencing the largest drop to 57% of normal operations.
The charts below illustrate the decrease in volumes to and from Canadian airports from March 16 to March 31 baselined against volumes from February 1 to March 15.
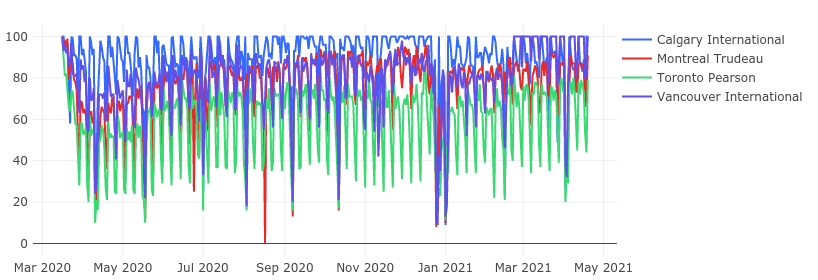
Figure 9.1. Canadian airports: Percent of normal trip volume to and from the airport.
Port activity
The ports of Montreal, Seattle, Tacoma and Vancouver have shown strong volumes with higher levels of variability over the last few weeks when baselined against volumes from February 1 to March 15, 2020. The overall traffic at ports on April 3rd was 99% of the baseline.
Figure 10. Port activity in Montreal, Seattle, Tacoma and Vancouver.
Overall, the Geotab analysis shows a decline in commercial transportation activity in North America from COVID-19. Although this is a general trend, for the Heavy-Duty trucking industry, we are observing that volumes seem to be less impacted and more consistent to pre-pandemic baseline volumes, especially when observing fuel fill-ups.
Commercial trade appears to be most impacted by the drop in volume of activity across the U.S.-Canada border and the drop in volume of activity to and from select Canadian and U.S. airports. Interestingly, activity to and from select sea ports has not changed significantly from normal pre-pandemic baseline volumes, with the exception of the Port of Seattle.

TL;DR 4 key takeaways Definition: The P0420 code indicates that the catalyst on bank 1 of a vehicle is operating below the efficiency threshold,...

TL;DR 4 key takeaways Definition: The P0455 indicates a large leak in the EVAP system, detected by the onboard OBD2. Fleet impact: Moderate in the...
.jpg)
AI agent platforms, the co-pilot model, and why technology should serve your people GOOGLE CLOUD NEXT 2026 RECAP , FLEET INTELLIGENCE SERIES PART 3...